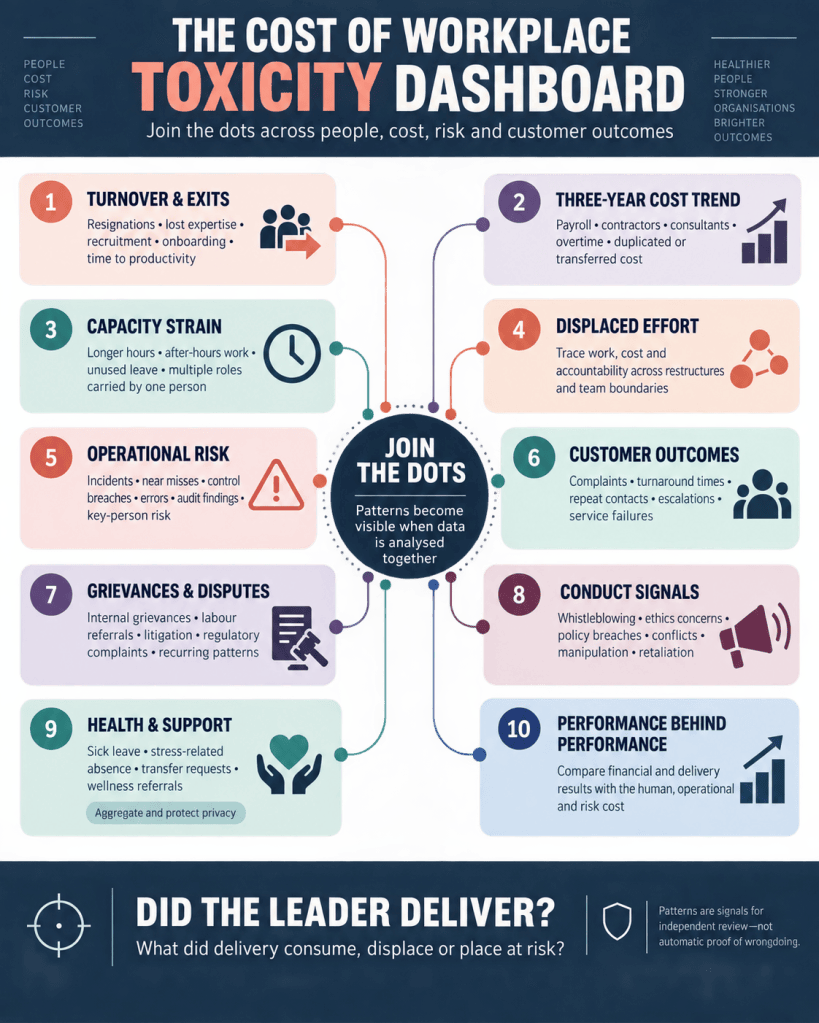
If leaders joined the dots across people, risk, operations and customer data, workplace bullying would stop looking like a “people issue” and start appearing as the business risk it is
I recently wrote about a choice women make in the workplace: we can be our sister’s keeper, or we can be the reason she wears her armour.
The post explored workplace bullying perpetrated by women and why it can feel especially traumatic. It is not necessarily because women are inherently more cruel, but because the harm violates an expectation of solidarity. We expect women—who often face many of the same structural obstacles—to understand what exclusion, stereotyping and being underestimated feel like. When another woman becomes the source of the harm, the betrayal can cut deeply.
But the problem is bigger than the gender of the perpetrator.
Workplace bullying, harassment and other forms of psychological harm are organisational problems. The International Labour Organization recognises bullying and mobbing as forms of psychological violence in the world of work. Research also links toxic workplace environments to lower engagement and poorer employee wellbeing. The World Health Organization estimates that depression and anxiety contribute to the loss of 12 billion working days globally each year.
Yet many organisations still treat bullying as an interpersonal dispute: a clash of personalities, a communication problem or dissatisfaction with a leader’s “style.”
That framing is convenient. It is also costly.
When financial performance disguises organisational damage
As organisations optimise operations, reduce costs and restructure to remain competitive, pressure intensifies. Leaner structures are not inherently toxic, but they can create conditions in which harmful leadership goes unchallenged: heavier workloads, fewer control layers, insecure employees and an overriding focus on short-term delivery.
A leader who produces strong financial results can become difficult to confront. Senior leaders may see the behaviour but avoid an honest conversation because they fear destabilising performance, losing a “high performer” or antagonising someone with influence.
The trajectory looks good, so the dysfunction is tolerated.
The organisation’s systems may then be used defensively. HR examines an employee grievance. Risk reviews an operational incident. Compliance considers a policy breach. Customer service analyses complaints. Finance celebrates a reduction in headcount. Each function answers its own question, closes its own case and files its own report.
No one asks what the combined evidence is saying.
This fragmentation can protect the organisation from an immediate legal or reputational threat, while leaving the underlying risk untouched. It can also protect a harmful leader. A skilled perpetrator does not need to suppress every signal. They need only ensure that each signal appears isolated, explainable and too small to trigger decisive action.
The resignation that looks like a saving
Consider employee turnover.
When several people resign from the same team, a leader may describe them as disgruntled employees who resisted change or disliked the leader’s demanding style. If those employees are not replaced, the leader may even appear to have saved money.
But the work did not disappear when the people did.
It may have been absorbed by the remaining team, transferred to another unit, outsourced, delayed, automated without adequate controls—or quietly abandoned. The salary line falls, but overtime, fatigue, errors, customer complaints, control failures and key-person dependency may rise elsewhere.
What appears as a saving in one cost centre may be a growing liability in another.
This is why the number of resignations, viewed alone, tells us very little. The more useful question is: What changed around the resignations, where did the work go, and what happened next?
A “cost of toxicity” dashboard
Organisations already hold much of the data required to answer that question. The problem is that it sits in separate functions, with different owners, definitions and reporting cycles.
Imagine what leadership could see if the following indicators were analysed together at team and leader level, with appropriate privacy safeguards:
1. Turnover and the cost of exits
How many people resigned from the team during the year? What was the cost of lost expertise, recruitment, onboarding, training and the productivity gap before a replacement became fully effective? How many employees left without another role lined up, or cited leadership, culture, workload or psychological safety?
Exit data should be analysed for patterns—not dismissed one person at a time.
2. The team’s three-year cost trend
What has it cost to run the same function over three years? A declining permanent headcount can mask increases in contractors, consultants, overtime, temporary resources, duplicated work and costs transferred to adjacent teams.
The relevant measure is not simply payroll. It is the total cost of delivering the work.
3. Working hours and capacity strain
Are working hours increasing while headcount falls? Are employees routinely working after hours or during leave? Is unused leave accumulating? Are particular employees carrying responsibilities that previously belonged to several roles?
A team can meet its targets while consuming its people as an unreported resource.
4. Restructuring and displaced effort
Has the area recently been restructured? Restructuring can solve genuine organisational problems, but it can also reshuffle cost, work and accountability. A role may disappear from one team while its activities reappear—unnamed and unfunded—in another.
Leadership should trace work and risk across organisational boundaries before declaring a saving.
5. Operational risk indicators
What do incidents, near misses, control breaches, audit findings, processing errors, overdue actions and key-person dependencies reveal? Do these indicators deteriorate after resignations, prolonged vacancies or changes in leadership?
The temporal sequence matters. A resignation followed by a spike in errors may not prove causation, but repeated patterns justify investigation.
6. Customer complaints and service outcomes
Are complaints, turnaround times, repeat contacts, escalations or service failures connected to the affected team? Did customer outcomes worsen after experienced employees departed or workloads were redistributed?
Customers often encounter the operational consequences of dysfunction before executives do.
7. Grievances, disputes and external complaints
Are there internal grievances, disciplinary disputes, labour referrals, litigation or regulatory complaints associated with the team or leader? Individually, each case may appear inconclusive. Collectively, they may point to a recurring pattern of intimidation, retaliation, discrimination or procedural unfairness.
“No case was proven” is not the same as “there is no pattern.”
8. Whistleblowing and conduct signals
Have there been whistleblowing reports, ethics concerns, policy breaches, conflicts of interest, manipulation of information or allegations of illegal conduct connected to the area?
Dysfunctional cultures do not always conceal wrongdoing. Sometimes they conceal incompetence, poor controls or unsustainable delivery. But fear, retaliation and excessive loyalty to a powerful leader can create ideal conditions for inappropriate, unethical or illegal behaviour to remain unchallenged.
9. Absence, illness and requests for support
Is sick leave rising? Are stress-related absences, disability claims, requests for transfer or referrals to employee-wellness services increasing? Is there a concentration in one team or reporting line?
These indicators must be handled in aggregated, privacy-preserving form. Their purpose is not to diagnose individuals or allow managers access to confidential health information. It is to identify organisational strain early enough to act.
10. The performance behind the performance
Finally, leaders should compare all these indicators with the team’s financial and delivery results. Are good results being achieved through a healthy, repeatable operating model—or through fear, unpaid labour, deferred controls and the exhaustion of capable people?
The question is not only, “Did the leader deliver?” It is also, “What did delivery consume, displace or place at risk?”
Correlation is a signal, not a verdict
A joined-up dashboard must not become an automated accusation system. High turnover, sick leave or customer complaints do not by themselves prove bullying. There may be legitimate explanations, including difficult market conditions, major transformation or an unusually demanding operating cycle.
The data should trigger curiosity, independent review and humane conversation—not summary judgment.
Equally, organisations should not demand perfect proof from each isolated source before recognising a pattern. A cluster of weak signals can be more informative than one dramatic incident. Triangulation is how leadership moves from anecdote to evidence.
Good governance would include clear thresholds, contextual comparison, independent oversight, protection against retaliation and strict controls over personal information. It would also give leaders and teams a fair opportunity to explain what the numbers cannot show.
What organisations choose not to measure remains easy to deny
Toxic behaviour survives partly because its costs are scattered across budgets, systems and human beings.
Finance sees lower headcount. HR sees voluntary exits. Risk sees incidents. Compliance sees individual allegations. Wellness providers see distress. Customer teams see complaints. Remaining employees see the extra work. The executive committee sees the quarterly result.
All of them may be looking at different parts of the same story.
Leaders who bully, intimidate or manipulate often depend on this fragmentation. They manage each data point, explain each departure and challenge each complaint as an isolated event. If no one joins the dots, the pattern remains deniable.
Organisations need to make the invisible cost visible. That means measuring culture not only through annual surveys, but through the operational, financial, conduct, customer and health signals culture produces every day.
Workplace toxicity is not merely a “people problem.” It is a performance problem, a risk problem, a governance problem and, ultimately, a leadership problem.
When organisations learn to see the whole system, strong results can no longer be used as camouflage for the damage required to produce them.
And perhaps fewer women—and fewer people—will need to arrive at work wearing armour.
Sources for further reading
● International Labour Organization, Framework Guidelines for Addressing Workplace Violence in the Health Sector (includes bullying and mobbing as psychological violence): https://www.ilo.org/publications/framework-guidelines-addressing-workplace-violence-health-sector
● World Health Organization, Mental health at work: https://www.who.int/news-room/fact-sheets/detail/mental-health-at-work
● CIPD, Good Work Index 2024: https://www.cipd.org/en/knowledge/reports/goodwork/
● Rasool et al., How Toxic Workplace Environment Effects the Employee Engagement: The Mediating Role of Organizational Support and Employee Wellbeing: https://pmc.ncbi.nlm.nih.gov/articles/PMC7956351/
If this article resonates, share it with a leader who believes that culture should be measured with the same discipline as financial performance.

